It was another late night at the data science lab when I first discovered the true magic of geospatial visualization. The soft glow of my monitor illuminated a world of possibilities as I delved into the powerful combination of Folium and GeoPandas. Let me take you on a journey through this fascinating landscape of data visualization, where maps come alive and stories emerge from coordinates.
Chapter 1: The Foundation – Setting Up Our Explorer’s Kit
Before we embark on our adventure, let’s gather our essential tools. Like any well-prepared explorer, we need the right equipment (mainly folium and geopandas):
import folium
import geopandas as gpd
import pandas as pd
from folium import plugins
These libraries are our compass and map in the digital wilderness. GeoPandas extends the popular pandas library to work with geospatial data, while Folium helps us create beautiful, interactive maps that tell our stories.
Chapter 2: The First Discovery – Loading and Transforming Geospatial Data
Picture yourself discovering an ancient map in a dusty archive. That’s how it feels when you first load a shapefile:
# Load world boundaries from GeoPandas datasets
world = gpd.read_file(gpd.datasets.get_path('naturalearth_lowres'))

# Create a sample dataset of major world cities
cities_data = '''
city_name,latitude,longitude,population
New York,40.7128,-74.0060,8400000
Tokyo,35.6762,139.6503,37400000
London,51.5074,-0.1278,8900000
Paris,48.8566,2.3522,2100000
Mumbai,19.0760,72.8777,20400000
Shanghai,31.2304,121.4737,27100000
São Paulo,-23.5505,-46.6333,22000000
Cairo,30.0444,31.2357,20400000
Sydney,-33.8688,151.2093,5300000
Lagos,6.5244,3.3792,14800000
'''

# Create DataFrame from our cities data
cities = pd.read_csv(StringIO(cities_data))

# Transform cities data into GeoDataFrame
geometry = gpd.points_from_xy(cities.longitude, cities.latitude)
cities_gdf = gpd.GeoDataFrame(cities, geometry=geometry)
Each shapefile is like a treasure map, containing boundaries of countries, cities, or natural features. GeoPandas helps us decode these digital artifacts into meaningful data structures.
Data Overview
print(world.head())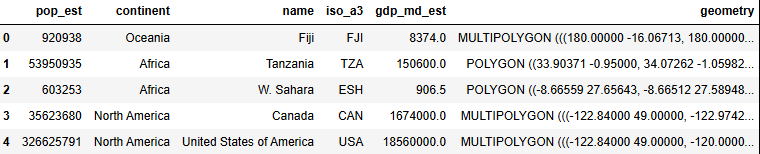
print(geometry)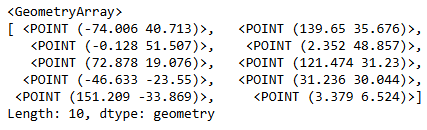
print(cities_gdf.head())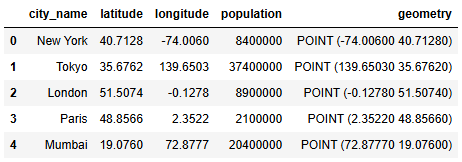
Chapter 3: The Art of Visualization – Creating Interactive Maps
Now comes the moment of truth – bringing our data to life. Like an artist with a canvas, we’ll create our masterpiece:
# Create base map
m = folium.Map(location=[0, 0], zoom_start=2)

# Add choropleth layer
folium.Choropleth(
    geo_data=world,
    name='choropleth',
    data=world,
    columns=['name', 'pop_est'],
    key_on='feature.properties.name',
    fill_color='YlOrRd',
    fill_opacity=0.7,
    line_opacity=0.2,
    legend_name='Population Estimate'
).add_to(m)

# Add city markers with clustering
marker_cluster = plugins.MarkerCluster().add_to(m)
for idx, row in cities_gdf.iterrows():
    folium.Marker(
        location=[row.geometry.y, row.geometry.x],
        popup=row['city_name'],
        icon=folium.Icon(color='green', icon='info-sign')
    ).add_to(marker_cluster)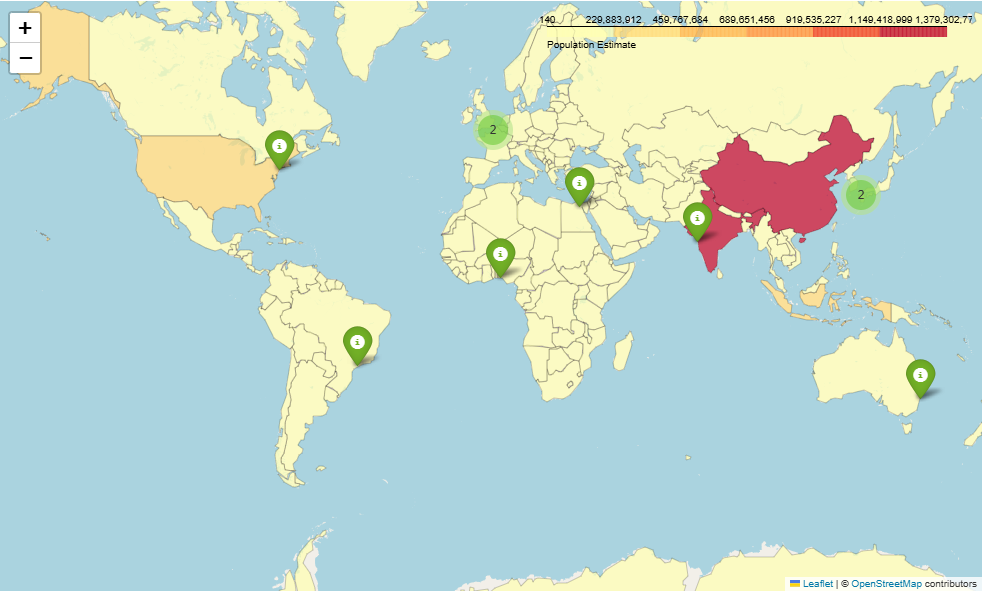
Chapter 4: Advanced Techniques – The Hidden Patterns
Like a detective uncovering clues, we can reveal hidden patterns in our data using advanced techniques:
# Create custom GeoJSON styling
def style_function(feature):
    return {
        'fillColor': '#ffaf00',
        'color': 'black',
        'weight': 1,
        'dashArray': '5, 5'
    }

# Add GeoJSON overlay with custom styling
folium.GeoJson(
    world,
    name='Custom Style',
    style_function=style_function,
    tooltip=folium.GeoJsonTooltip(
        fields=['name', 'pop_est'],
        aliases=['Country:', 'Population:'],
        localize=True
    )
).add_to(m)

# Add heatmap layer
heat_data = [[row.geometry.y, row.geometry.x] for idx, row in cities_gdf.iterrows()]
plugins.HeatMap(heat_data).add_to(m)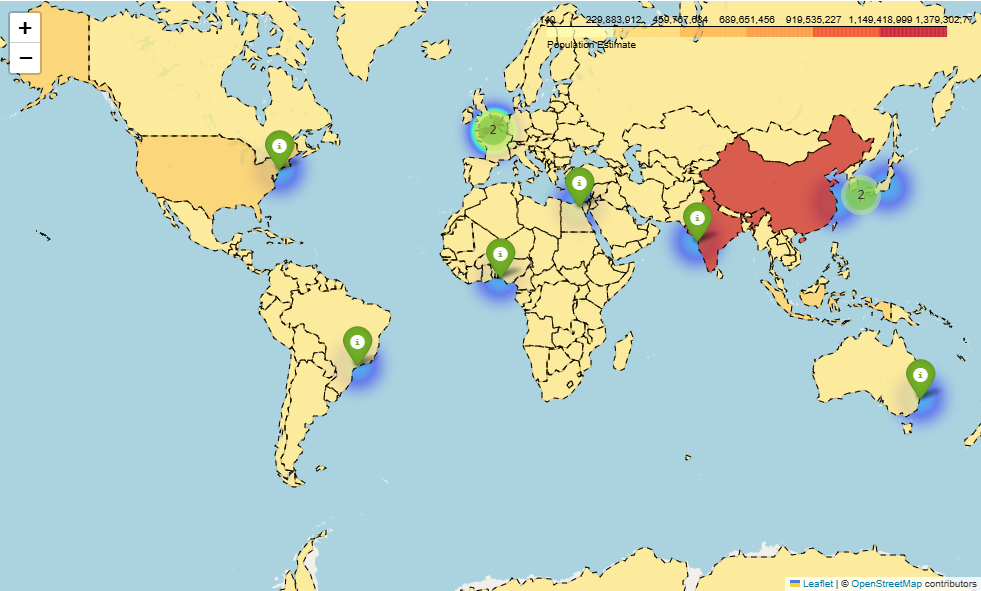
Chapter 5: The Power of Interaction – Adding Dynamic Elements
Like adding chapters to our story, we can enhance our map with interactive elements:
# Add layer control
folium.LayerControl().add_to(m)

# Add fullscreen option
plugins.Fullscreen().add_to(m)

# Add minimap
plugins.MiniMap().add_to(m)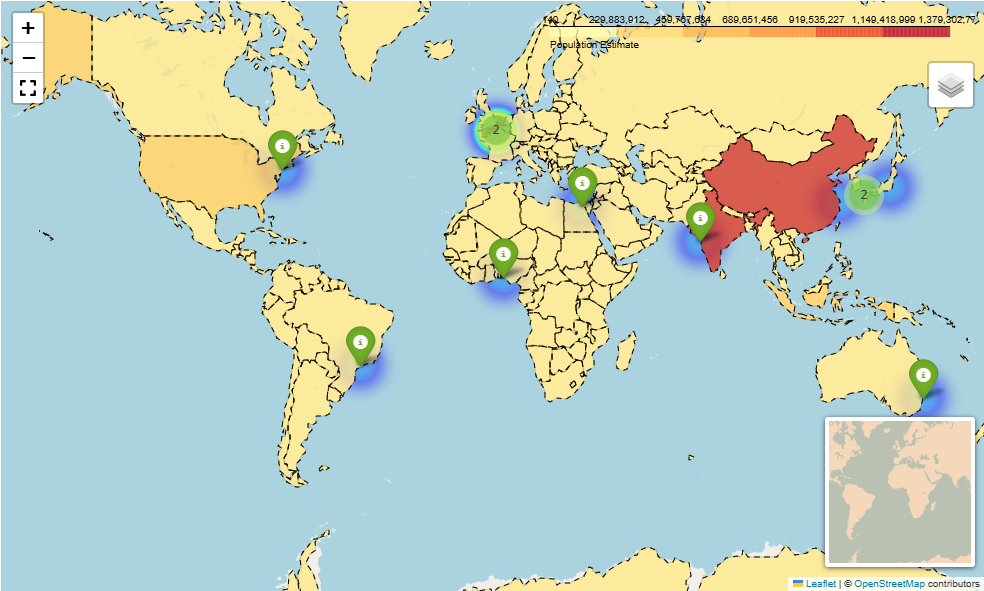
Epilogue: Beyond the Basics
Our journey doesn’t end here. The true power of geospatial visualization lies in its ability to tell stories that numbers alone cannot. Whether you’re tracking wildlife migration patterns, analyzing urban development, or visualizing climate change impacts, these tools provide the means to transform raw data into compelling visual narratives.
Remember these key insights from our journey:
- GeoPandas provides the foundation for handling geospatial data with the familiarity of pandas
- Folium brings your data to life with interactive, web-based maps
- Combining different visualization techniques can reveal deeper insights
- Custom styling and interactive elements enhance user engagement
- Layer management helps organize complex visualizations
As you continue your own exploration, remember that every dataset tells a story waiting to be discovered. The tools we’ve discussed are your key to unlocking these tales hidden within the coordinates and shapes of our world.
Happy mapping, fellow data explorer!